This help page explains how to use Geology Roam to view and create maps of British Geological Survey data.
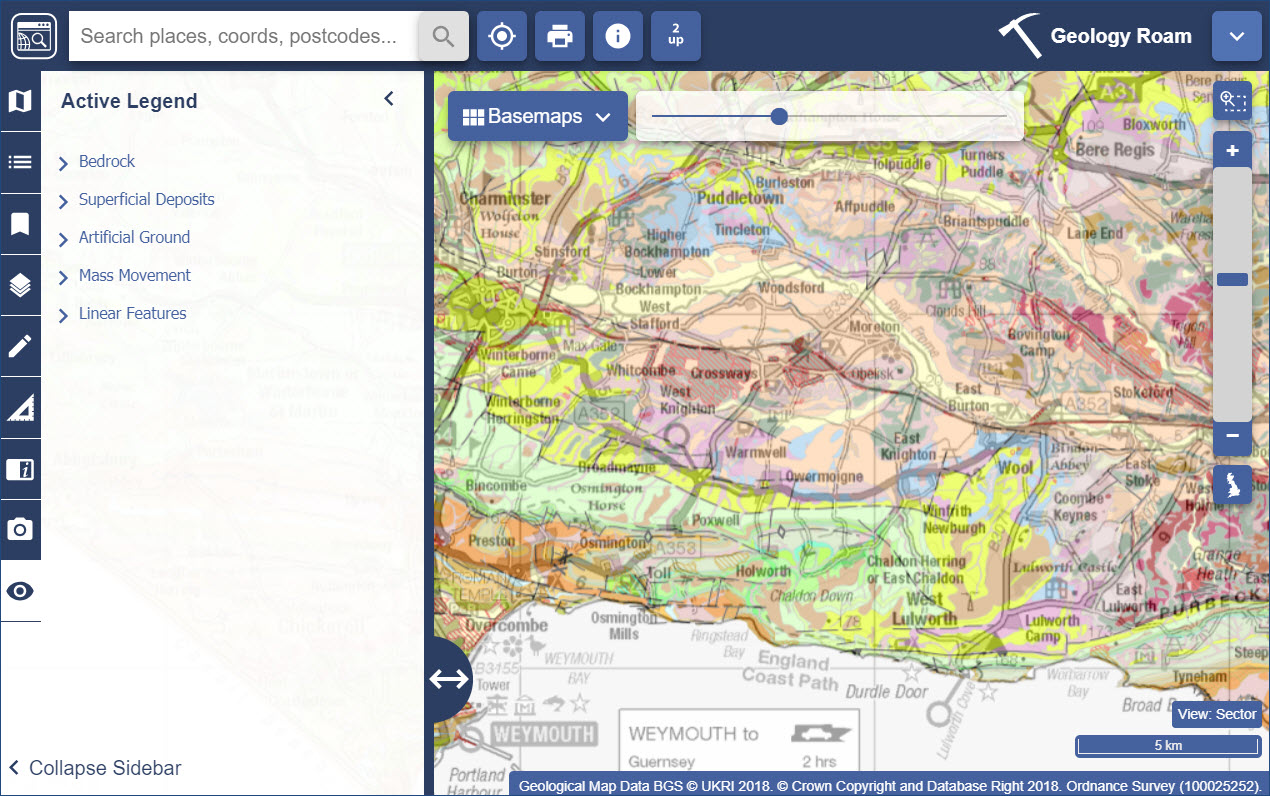
Geology Roam enables you to view and print maps using British Geological Survey (BGS) and Ordnance Survey data at one of 12 predefined scales.
Prints can be created from A4 to A0 in size.
You can navigate in Geology Roam by panning (moving the map in any direction) and by zooming in and out of the map.
To pan you can:
To zoom in/out of the map, you can:

 to
zoom in and click the minus sign
 to zoom out.
 to zoom in or
out.
to zoom in or
out.You can search for a location in Roam using a place name, postcode, grid reference, easting/northing or latitude/longitude.
 near the top left
of the map window.
Notes:
You will not find landmarks and places of interest such as Edinburgh Castle or Nelsons Column or county names such as Cornwall. These are not currently listed in the gazetteer.
Only search for places in the UK.
To search using the Coordinate / Grid Ref. Search options:
Geology Roam has 12 different predefined map scales, called views.
The views consist of different BGS geology data and background Ordnance Survey map products which are appropriate for each view's scale (e.g. the Local view uses the BGS DiGMapGB-50 data and the OS 1:50 000 scale raster).
The following table lists the scale and map products used for each view, to help you decide which view is appropriate for your purpose.
| View | Standard Geology
Map Product(s) |
Basemaps |
Background
Map Product |
Scale |
|---|---|---|---|---|
| British Isles | DiGMapGB-625
Rock Units
DigRock250 Offshore Geology DigSBS Sea Bed Sediments |
Rock Type (DiGMapGB-625) | Digital
Chart of the World
(Country Outlines) |
1:5 600 000 |
| Mainland | DiGMapGB-625
Rock Units
DigRock250 Offshore Geology DigSBS Sea Bed Sediments |
Rock Type (DiGMapGB-625)
Hydrogeology |
OS Miniscale® | 1:1 250 000 |
| National | DiGMapGB-625
Rock Units
DigRock250 Offshore Geology DigSBS Sea Bed Sediments |
Rock Type (DiGMapGB-625)
Hydrogeology |
OS Miniscale® | 1:625 000 |
| Range | DiGMapGB-250
Rock Units
DigRock250 Offshore Geology DigSBS Sea Bed Sediments |
Rock Type (DiGMapGB-250)
Soil Calcium Carbonate Soil Strength Soil Texture Geological Indicators of Flooding Maximum Permeability Minimum Permeability |
OS Miniscale® | 1:375 000 |
| County | DiGMapGB-250
Rock Units
DigRock250 Offshore Geology DigSBS Sea Bed Sediments |
Rock Type (DiGMapGB-250)
Soil Calcium Carbonate Soil Strength Soil Texture Geological Indicators of Flooding Maximum Permeability Minimum Permeability |
OS Miniscale® | 1:250 000 |
| District | DiGMapGB-250
Rock Units
DigRock250 Offshore Geology DigSBS Sea Bed Sediments |
Rock Type (DiGMapGB-250)
Soil Calcium Carbonate Soil Strength Soil Texture Geological Indicators of Flooding Maximum Permeability Minimum Permeability |
OS 1:250 000 Raster | 1:150 000 |
| Sector | DiGMapGB-50 Rock Units | Rock Type (DiGMapGB-50)
Soil Calcium Carbonate Soil Strength Soil Texture Geological Indicators of Flooding Maximum Permeability Minimum Permeability |
OS 1:250 000 Raster | 1:100 000 |
| Division | DiGMapGB-50 Rock Units | Rock Type (DiGMapGB-50)
Soil Calcium Carbonate Soil Strength Soil Texture Geological Indicators of Flooding Maximum Permeability Minimum Permeability |
OS 1:250 000 Raster | 1:75 000 |
| Local | DiGMapGB-50 Rock Units | Rock Type (DiGMapGB-50)
Soil Calcium Carbonate Soil Strength Soil Texture Geological Indicators of Flooding Maximum Permeability Minimum Permeability |
OS 1:50 000 Raster | 1:50 000 |
| Plot | DiGMapGB-10 or 25 Rock Units | Rock Type (DiGMapGB-10
or 25)
Rock Type (DiGMapGB-50) Rock Units (DiGMapGB-50) Soil Calcium Carbonate Soil Strength Soil Texture Geological Indicators of Flooding Maximum Permeability Minimum Permeability |
OS 1:50 000 Raster | 1:25 000 |
| Detailed | DiGMapGB-10 or 25 Rock Units | Rock Type (DiGMapGB-10
or 25)
Rock Type (DiGMapGB-50) Rock Units (DiGMapGB-50) Soil Calcium Carbonate Soil Strength Soil Texture Geological Indicators of Flooding Maximum Permeability Minimum Permeability |
OS 1:25 000 Raster | 1:10 000 |
| Plan | DiGMapGB-10 or 25 Rock Units | Rock Type (DiGMapGB-10 or 25) | OS 1:25 000 Raster | 1:5 000 |
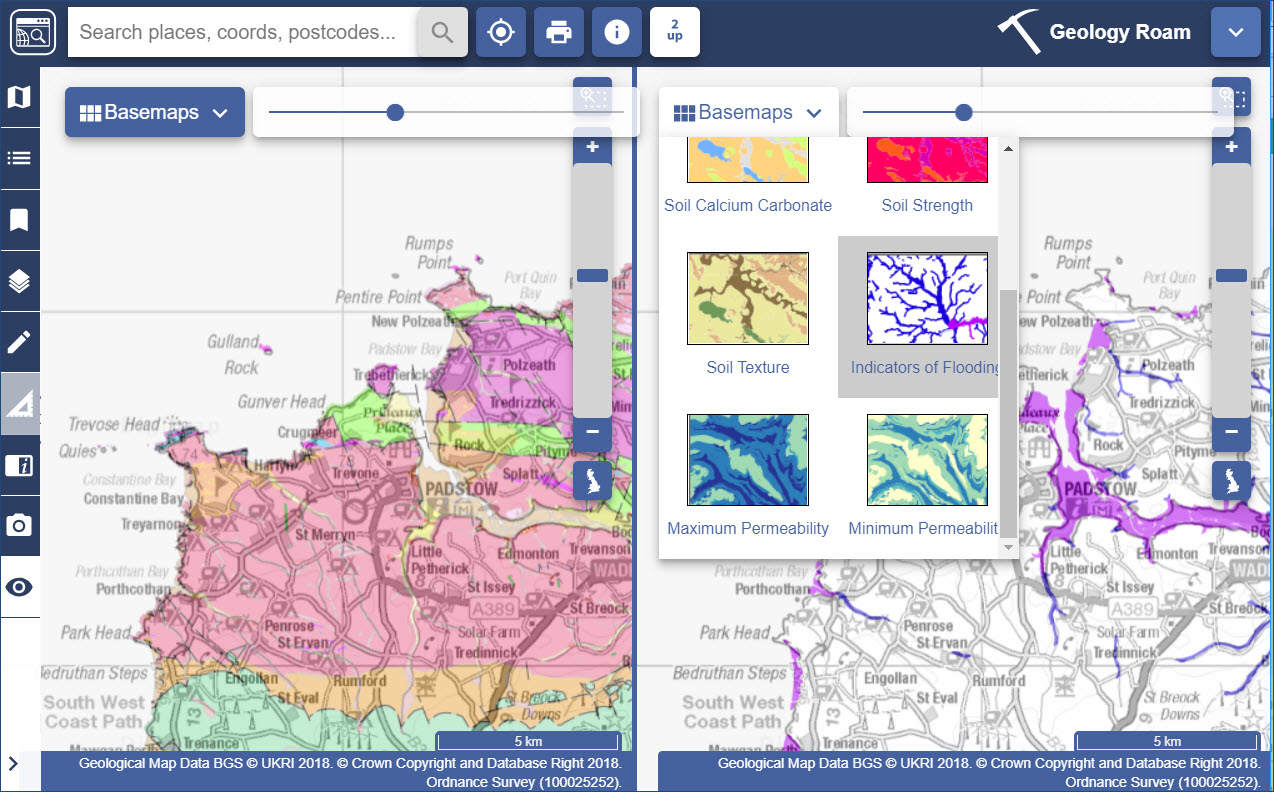
Basemaps offer a different view of the geology data or some alternative map data products.
 in the top middle of the map to change the
Basemap that is being displayed.
 In several collections, you can add more data to your map with the Overlays menu. Just check the box next to any available layer to display it on your map.
The options available vary by collection, but include:
You can select to add a 3D terrain backdrop to your maps in Roam, to give a clearer idea of the terrain in your area.
Only found in Ordnance Survey Collection, this allows you to view the locations of over 600 different types of feature. Categories include Accommodation, Commercial Services, Attractions, Sports, Education and more.
Only found in Ordnance Survey Collection, this allows you to view UK postcode boundaries. As you zoom in, more detailed postcodes are displayed.
This option, available on a tab in the Overlays menu, allows you to add a web map service of map data and view it, overlaid, on your map. In the sample image below, an elevation map of the UK has been added.

Select Search WMS Feed.
Check the box next to any WMS to select it.
Select Add Selected Layers to map.
Your WMS should be visible in the WMS tab and your map display changed.
In Roam, select Overlays from the sidebar.
Select the WMS tab.
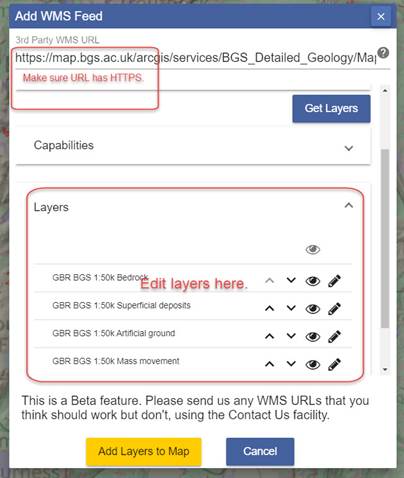
Select Manually add WMS Feed
Paste your link into the first line of the box, titled ‘3rd Party WMS URL’.
NOTE: if your URL has HTTP at the beginning, please change this to HTTPS.
Select Get Layers.
Select the eye icon to turn a layer on or off.
Use the arrows to change the order of display of any layer.
Select the pencil icon to edit the name of any layer.
Select Add Layers to Map.
Your WMS should be visible in the WMS tab and your map display changed.
1. You can switch WMS on or off in the WMS tab. Just select the button next to each WMS on or off.
2. There is an opacity slider under each WMS to let you adjust your map display. Just move it left or right to see more or less of your WMS map data.
In Geology Roam it is possible to customise which features are displayed on the map (e.g. display only Bedrock or Superficial Deposits).


 on
the top menu bar.
 The drawing tools in Geology Roam allow you to draw symbols, lines, polygons and text on your maps. You can add labels to these features and have the ability to select colours and styles for them too.
Below is a summary of the main options available.
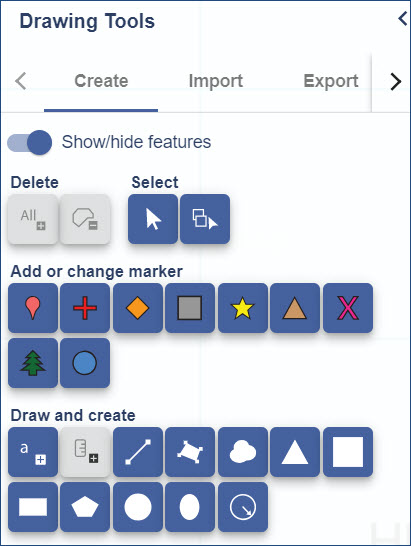
Add features using the tools on the Create tab.
Select from the point, text, line or area tools, and click on the map to start drawing.
Text colour and font size can be set using the Text Settings options.
Area style settings can be set using the Fill and Stroke settings, to select the colour and opacity of the fill and the colour, style and width of the outline.
Line style settings can be set using the Stroke settings.
Use the modify tools to add labels, reposition, resize and reshape features drawn.
To edit the colour and styling of text, line or areas drawn, click on the Select tool (or the drag to select tool) and then click on the feature you want to edit to select it, it will be highlighted. Next, change the colour and style settings you want to change. Then deselect the feature(s) by clicking away from the feature in an area where you have no annotations.
You can import a dataset to display it as features on your map using the Import tab. Supported formats are:
To export your drawings - click on the Export tab, choose a file format, give your file a name and click Export.
To save a set of annotations you have drawn, use the My Maps...Save tab.
Give your map a name and click Save and the map along with any annotations will be saved.
To open a saved map and set of annotations, click on the My Maps...Open tab.
Select the map together with annotations you want to view.
Geology Roam allows you to create printable maps in A4 to A0 size and in portrait or landscape layout in a variety of formats and at user defined scales.

To create a printable map:
 on the top menu bar.
Map Labels: Selecting the Map Labels option will print labels for the polygon data on your map (i.e. bedrock and superficial geology layers). Polygons are labelled with their Rock Unit code. Labels are placed in the centre of each polygon, unless the centre of the polygon is beyond the extent of the map, in which case the label is repositioned so it is within the map extent. Small polygons under a certain size (dependant on map scale) are not labelled as the label would obscure the polygon. Finally, overlapping labels are not printed. If overlapping labels are present, one of them will not be printed; this results in a clearer, more useful map.

The Map Information tab displays spatial reference information about the current map view. The information will update as you pan and zoom the map.

My Maps enables you to open and save maps you have previously saved.
My Maps enables you to open and save maps you have previously saved.
1. To save a map and any annotations you have drawn, open My Maps.
2. Select Save map.
3. Give your map a name.
4. Select Save and the map along with any drawings will be saved.
To open a saved map select My Maps.
If you already have drawings present on your map and you try and open another map with drawings, you will be asked to either replace your existing drawings or to merge them.
Roam's Measurement Tools enable you to measure distances and areas on your map.
Select Measurement Tools tab on the sidebar to open.

Click once on the map to start measuring.
Move the mouse pointer along to the next point. Clicking once on the map will add a point.
Double click to finish measuring. The total distance or area measurement is displayed in the measurement tools sidebar.

Measurements can be deleted using the Delete measurements button.
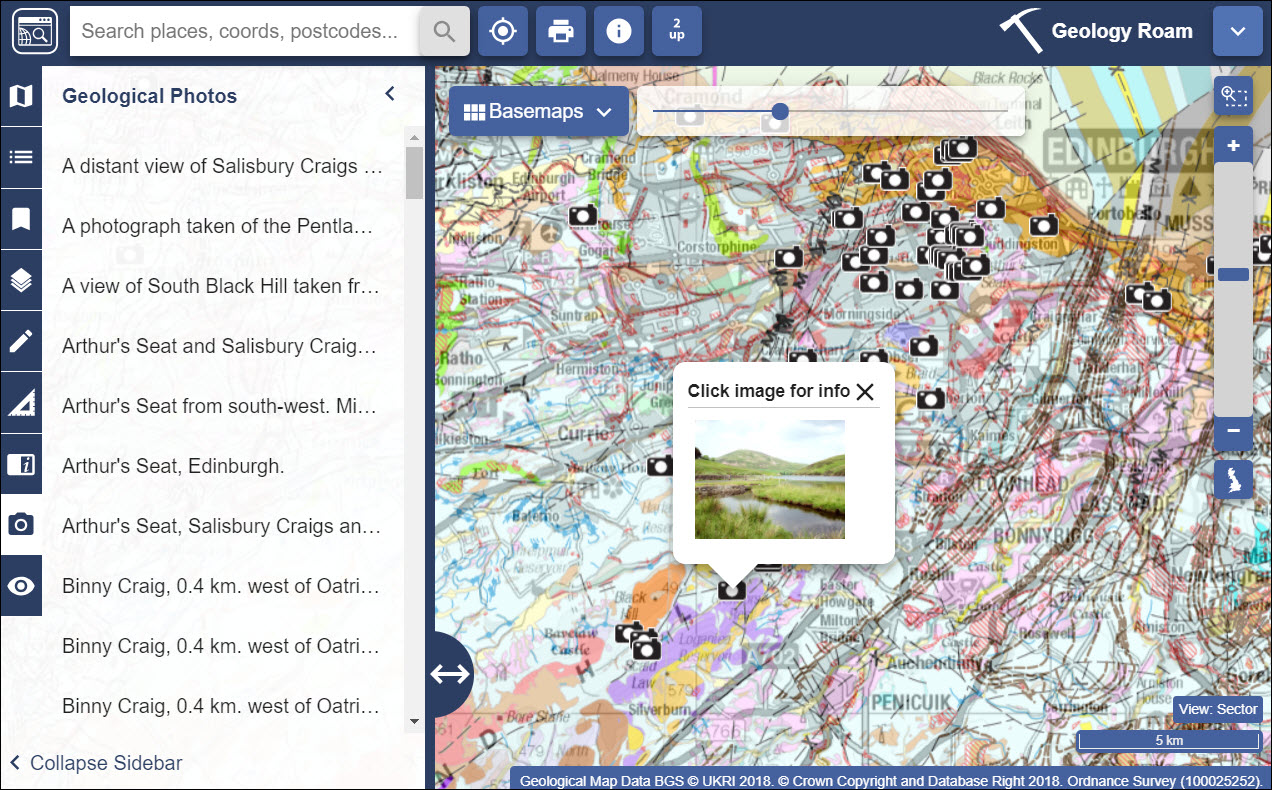
You can view over 3000 geological images to view in Geology Roam. Members of the BGS have taken photos of rocks, landforms and other geological features in the landscape.
These are concentrated mainly in upland areas such as Cumbria, the Peak District, North Wales and the Dorset Coast.
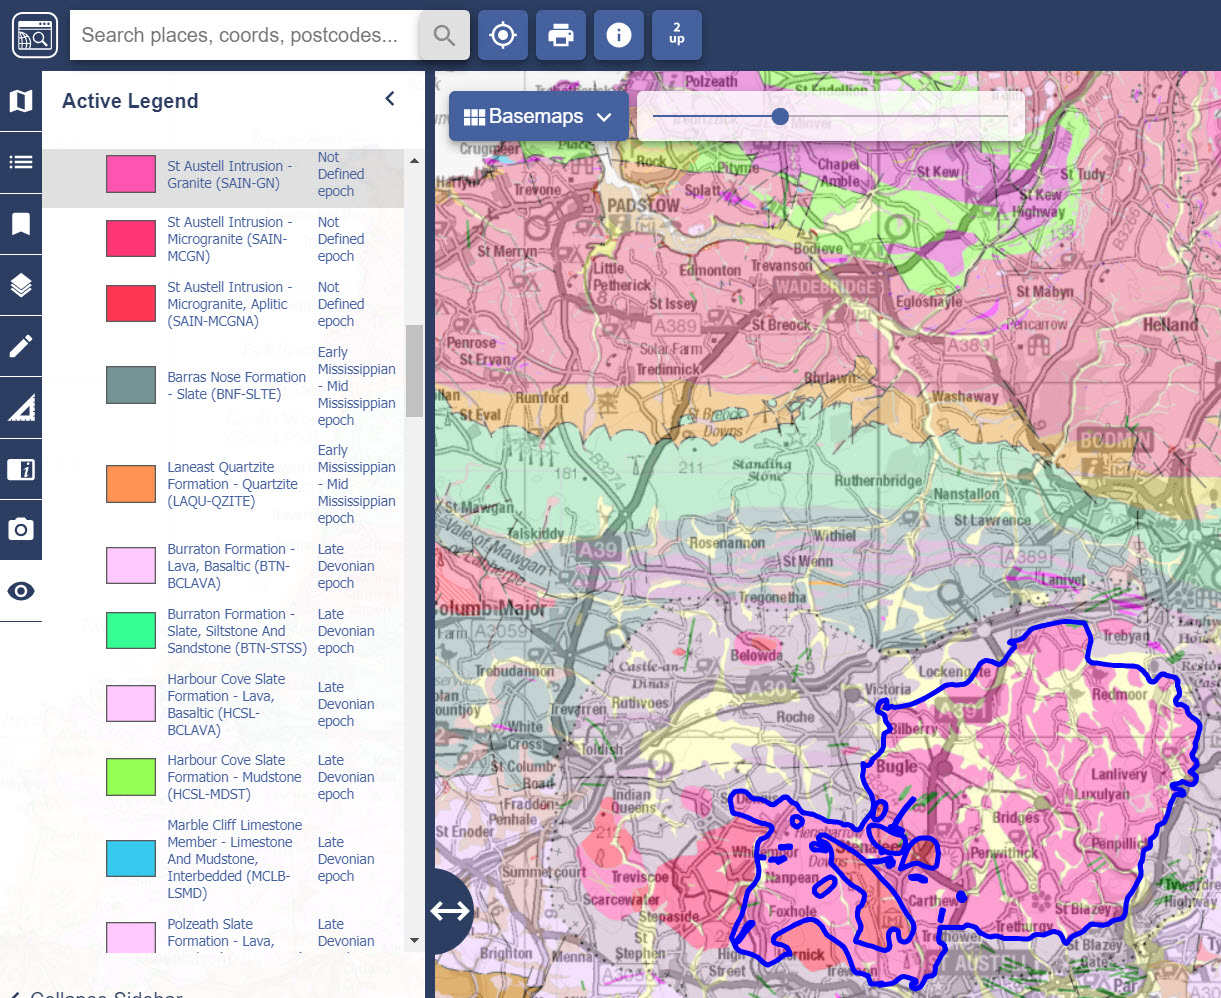
The Active Legend provides a means of highlighting the geological features and finding out their name and era.
The 2 up View feature of Geology Roam shows historic two maps of the same location.
 from the top menu bar. The
same map will appear in both map windows of the 2 up View.