
![]()
![]()
![]()
![]()
![]()
This help page explains how to use Ancient Roam to view and print historic Ordnance Survey maps.

Ancient Roam enables you to view and print maps using Ordnance Survey data at one of 12 pre-defined scales, or map views.
Prints can be created at user defined scales, A4 to A0 size; landscape or portrait orientation and include annotations.

Note: To expand/collapse the left hand panel click the arrows
between the panel and the map  .
.
You can navigate in Ancient Roam by panning (moving the map in any direction) and by zooming in and out of the map.
To pan you can:
To zoom in/out of the map, you can:

You can search for a location in Ancient Roam using a place name, postcode, grid reference, easting/northing or latitude/longitude.
Type the place name, road name, partial postcode or full postcode (e.g. EH9 1PR) in the search box, and select the magniosying glass.
If there is more than one match for your place name, the search results will be displayed below the search box. Click the place name you are interested in to view in the map window.
Notes:
Only search for places in the UK.
To search using the Coordinate / Grid Ref. Search options:
Once you have located your area of interest, zoom in to start viewing historical maps.
The Timeline shows the availability of historical maps for the current location and view level for each decade.

Using the timeline:


The 2 up View feature of Ancient Roam shows historic two maps of the same location but from different decades, at the same time. This allows places to be shown side by side to see how the landscape has changed over time.

To view a place in the 2 up View:
 in the top of the map window. The same map will appear in both map
windows of the 2 up View.
in the top of the map window. The same map will appear in both map
windows of the 2 up View.NB: Searching, the Overview Map and Map Information are all available in 2 up View and can be accessed via the left-hand menu panel and the Search button in the top right.
Ancient Roam has 17 different pre-defined map scales, called views. The 5 smallest scale views (i.e. the 5 most zoomed out views) consist of contemporary Ordnance Survey map data and are intended as reference for you to locate your area of interest more easily. These views are highlighted by the 'Modern' section on the zoom slider. There are 12 historical map views consisting of different historical map data which are appropriate for that view's scale. These views are highlighted by the 'Historical' section on the zoom slider. The following table lists the scale and map products used for each view, to help you decide which view is appropriate for your purpose.
| View | Modern or Historical maps | Map Product | Scale (approx) |
|---|---|---|---|
| GB | Modern |
|
1:6000000 |
| Regional | Modern |
|
1:850000 |
| Metropolitan | Modern |
|
1:280000 |
| District | Modern |
|
1:70000 |
| County | Modern |
|
1:28000 |
| Shire View 1 | Historical |
|
1:20000 |
| Shire View 2 | Historical |
|
1:15000 |
| Shire View 3 | Historical |
|
1:10000 |
| Shire View 4 | Historical |
|
1:7500 |
| Parish View 1 | Historical |
|
1:5000 |
| Parish View 2 | Historical |
|
1:2500 |
| Street View 1 | Historical |
|
1:1800 |
| Street View 2 | Historical |
|
1:1250 |
| Plan View 1 | Historical |
|
1:1000 |
| Plan View 2 | Historical |
|
1:750 |
| Plan View 3 | Historical |
|
1:500 |
| Plan View 4 | Historical |
|
1:250 |
This option, available on a tab in the Overlays menu, allows you to add a web map service of map data and view it, overlaid, on your map. In the sample image below, an elevation map of the UK has been added.

Select Search WMS Feed.
Check the box next to any WMS to select it.
Select Add Selected Layers to map.
Your WMS should be visible in the WMS tab and your map display changed.
In Roam, select Overlays from the sidebar.
Select the WMS tab.
Select Manually add WMS Feed
Paste your link into the first line of the box, titled ‘3rd Party WMS URL’.
NOTE: if your URL has HTTP at the beginning, please change this to HTTPS.
Select Get Layers.
Select the eye icon to turn a layer on or off.
Use the arrows to change the order of display of any layer.
Select the pencil icon to edit the name of any layer.
Select Add Layers to Map.
Your WMS should be visible in the WMS tab and your map display changed.

1. You can switch WMS on or off in the WMS tab. Just select the button next to each WMS on or off.
2. There is an opacity slider under each WMS to let you adjust your map display. Just move it left or right to see more or less of your WMS map data.
The drawing tools in Roam allow you to draw symbols, lines, polygons and text on your maps. You can add labels to these features and have the ability to select colours and styles for them.
Roam allows you to create printable maps in A4 to A0 size and in portrait or landscape layout in a variety of formats and at user defined scales.
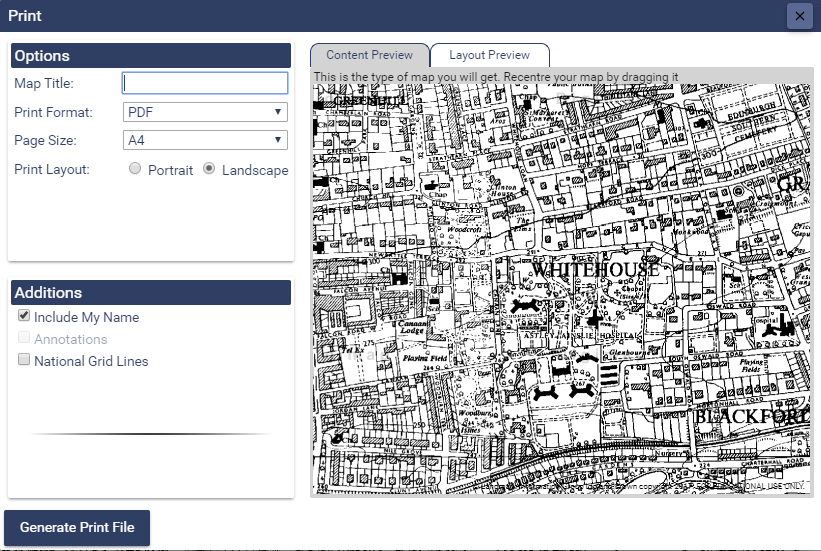
To create a printable map:
Use the Content Preview tab to view a small area of the map content
that you will get; use the Layout Preview tab to show the extents of the
area your map will cover based on the paper size and scale of the map.
Drag the map in either preview window to change the location of
your map.


The Map Information tab displays spatial reference information about the current map view. The information will update as you pan and zoom the map.

My Maps enables you to open and save maps you have previously saved.
1. To save a map and any annotations you have drawn, open My Maps.
2. Select Save map.
3. Give your map a name.
4. Select Save and the map along with any drawings will be saved.
To open a saved map select My Maps.
If you already have drawings present on your map and you try and open
another map with drawings, you will be asked to either replace your existing
drawings or to merge them.
Roam's Measurement Tools enable you to measure distances and areas on your map.
Select Measurement Tools tab on the sidebar to open.

Select distance or area.
Click once on the map to start measuring.
Move the mouse pointer along to the next point. Clicking once on the map will add a point.
Double click to finish measuring. The total distance or area measurement is displayed in the measurement tools sidebar.

Measurements can be deleted using the Delete measurements button..
Not found what you are looking for? Please ask a question or give feedback by emailing (digimap@ed.ac.uk) or chatting with the Digimap team.
Share a to this page.
You may also find more information or communicate with us on our Social Media sites:
![]()
![]()
![]()
![]()
| © University of Edinburgh. |