
![]()
![]()
![]()
![]()
![]()
Within some County Series map editions there is more than one map for the same location. This is because the area is at, or near to a county boundary. The County Series maps were surveyed and published on a county by county basis, not one national survey. So at the boundary of Shropshire and Staffordshire, for example mapping exists from both the Shropshire County Series Editions and the Staffordshire County Series Editions - hence two maps for the same location. EDINA have made the maps transparent, so a user can see were two maps exist. They can then choose which one they view by selecting or deselecting Counties from the list of overlapping county maps in the Overlapping Counties tab.
This overlapping map issue is not relevant for post 1945 National Grid maps. As these were surveyed and published as part of a national survey, there is no overlap of maps at county boundaries.
You can view the publishing date of a map by selecting the Map Information tool ![]() and then clicking on the historic map at the point you are interested in, this will open the Map Sheet Information box which contains the Year Published.
and then clicking on the historic map at the point you are interested in, this will open the Map Sheet Information box which contains the Year Published.
It is important that you click on the map at the place you are interested in and not just anywhere on the map. This is because the Map View you currently have on screen may consist of more than one separate map sheet, each having different publishing dates.
EDINA do not have survey dates for most of the maps in the Historic Digimap. Survey dates were not captured by Landmark Information Group when they digitised (scanned) the historic paper maps and no other digital resource currently exists which could provide this kind of information for all of the maps.
However, as of 1st March 2011, survey date information is available for the majority of Scottish County Series maps (both 1:10,560 and 1:2,500 scales). Survey dates for these maps were captured as part of a collaboration between EDINA and the National Library of Scotland (NLS). Further information about this project and the impacts on the maps can be found here.
There are cases where a map is visible but the Map Details tool does not provide any details. This is because the maps being drawn are the National Grid cookie cut version of the County Series sheets, but the National Grid tile might cross two county sheets from two different decades. For example, if a single National Grid tile crosses one County Series sheet from 1919 as well as a County Sheet from 1920 then the National Grid tile will be drawn for both 1910s and 1920s. However the Map Details tool only queries the County Series sheet. Therefore, if you are viewing 1910s, then no map details are returned for the area of the National Grid tile that is made up of the 1920s County Series sheet and vice versa.
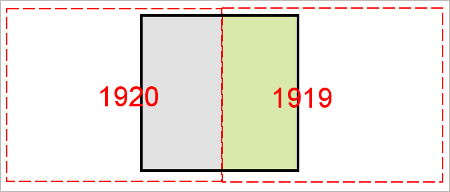
In the diagram below the National Grid tile (black outline) crosses two County Series sheets one from 1919 and one from 1920 (red dashed outlines) The National Grid tile will be displayed for 1910s and 1920s. When viewing 1910s decade, map details for the right hand half (green) of the National Grid tile will appear but not the for the left hand half. When viewing 1920s decade, map details for the left hand half (grey) of the National Grid tile will appear, but for the right hand half.
A blank white area is actually a valid map sheet, though you are viewing part of it which does not contain any map information. In modern digital seamless maps this is not a problem but with historic paper maps, (especially pre 1945 County Series maps) this white space can appear at coast lines or at County boundaries. For example a historic map sheet may contain details at the edge of a county. As the neighbouring county is mapped in a separate County Series, the map will just show white space where this neighbouring county is. If there is no map available in the currently selected Decade and Scale for the area you are viewing, you will see a message within the map area telling you so.
Yes, contemporary large scale mapping is available in Ancient Roam and can be displayed in either of the map windows by selecting the 'Contemporary' button at the right hand end of the timeline. This allows users to compare historic mapping with detailed modern mapping side by side.
Due to the technicalities of the underlying software, the drag to zoom tool is not available in the 2up View. However, it is possible to drag to zoom by holding down the SHIFT key and dragging a box (using the left mouse button)
The different historic map editions use different symbology. Currently no legend facility exists in Ancient Roam however www.old-maps.co.uk publish legends for the common map series available in Ancient Roam in their FAQ. See the question entitled 'what do the symbols on the maps mean?' on the following page: https://www.old-maps.co.uk/#/Pages/Faq
The contemporary mapping used in Ancient Roam uses Ordnance Survey Open Data which does not cover the Isle of Man. The most detailed mapping of the Isle of Man available from Ordnance Survey is the 1:50,000 Colour Raster dataset.
The map images available for download from the Historic Download are as provided as CCITT Group 4 TIFF format. However, there are two varieties of Group 4 TIFF:
Banded TIFF
This type of TIFF image is read in lines, or bands, across the whole image, until the image is completely displayed. This is the most common type used for general image data.
All the post 1945 National Grid map tile images and pre 1945 County Series National Grid cookie cut images available for download from Historic Digimap are in Banded TIFF format and can be read by a wide selection of image viewing software and GIS.
Tiled TIFF
This type of TIFF is read in square blocks, until the image is completely displayed. Tiled TIFF is more suitable than Banded TIFF for large images as only the blocks which will appear in the display need to be read. This is the preferred format for GIS use.
The original County Series Map Sheet images (i.e. not those cookie cut to match the modern National Grid) available for download from Historic Digimap are in Tiled TIFF format. They can be read by GIS software (e.g. MapInfo and ESRI ArcGIS) but only a few image viewing or processing applications.
Of those tested, the following image viewing applications will read and display the Original County Series Map Sheet Tiled TIFF images:
The following common image viewing software will not open the Original County Series Map Sheet Tiled TIFF images:
Note that the post 1945 National Grid map images and the Pre 1945 County Series map images cookie cut to the match the National Grid can be viewed in all of the above applications. All TIFF images, regardless of whether they are Banded or Tiled format can be read and displayed in MapInfo GIS or ESRI ArcGIS.
Not found what you are looking for? Please ask a question or give feedback by emailing (digimap@ed.ac.uk) or chatting with the Digimap team.
Share a to this page.
You may also find more information or communicate with us on our Social Media sites:
![]()
![]()
![]()
![]()
| © University of Edinburgh. |