Visualising OS MasterMap® Topography Layer Building Height Attribute in ArcGlobe

Introduction

Background information on OS MasterMap® Topography Layer Building Height Attribute (BHA) and details of the attributes supplied by Ordnance Survey can be found on the Building Height Attribute Overview page.

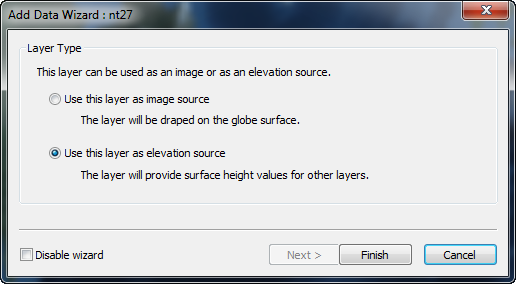
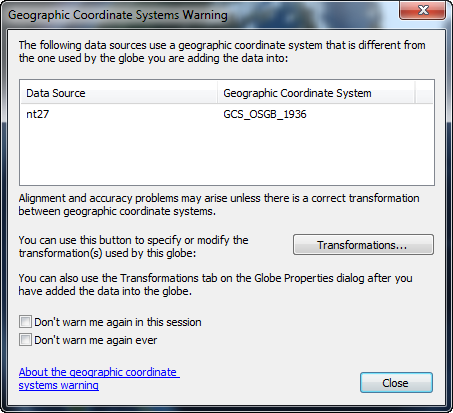
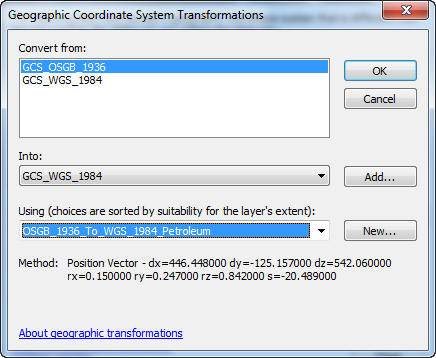
BHA data is available from Digimap in the File Geodatabase format, which is native to ESRI so requires no processing to be able to use it in ESRI products. It is easy to visualise BHA in File Geodatabase format using ArcGlobe or ArcScene. The following steps describe how to import the data in to ArcGlobe.

Getting started

Download the following datasets for your area of interest from Digimap using the OS Data Download application:

  1. BHA data (BHA data is found in the 'OS MasterMap' group): select 'File Geodatabase' as the format;
  2. OS Terrain™ 5 DTM: this will be used as the base (surface) heights for the area to provide a more accurate terrain model than is available by default in ArcGlobe;
  3. Optionally download any additional data you may wish to use as a backdrop, such as OS VectorMap® Local Raster or 1:25 000 Scale Colour Raster;

Visualising the result in ArcGlobe

  1. Open ArcGlobe and add in the OS Terrain 5 DTM downloaded from Digimap. You will be asked if you wish to use the DTM as and ‘image source’ or an ‘elevation source’. You should select the ‘elevation source’ option:
    ArcGlobe Add Data Wizard
  2. The Geographic Coordinate Systems Warning dialog will appear as the DTM is in a different coordinate system (British National Grid) from that used by ArcGlobe (WGS 84):
    ESRI geographic coordinate system warning
  3. You should specify the transformation used to ensure that the data is accurately positioned on the globe. Using the Transformations… button you should specify the ‘OSGB_1936_To_WGS_1984_Petroleum’ transformation:
    ESRI Geographic Coordinate System Transformation
  4. Adding BHA data from the File Geodatabase is achieved through the Add Data button. Once added you may need to zoom to the layer to view it: right click on the layer in the table of contents > Zoom To Layer.
  5. By default the data is not extruded vertically so appears flat on the earth’s surface. To visualise the buildings in 3D right click on the layer in the table of contents and select Properties and then click on the Globe Extrusion tab.
  6. Select the ‘Extrude features in layer’ checkbox and then in the ‘extrusion value or expression’ box enter the following:

    [relh2] * 1.5
    ESRI ArcGlobe layer properties

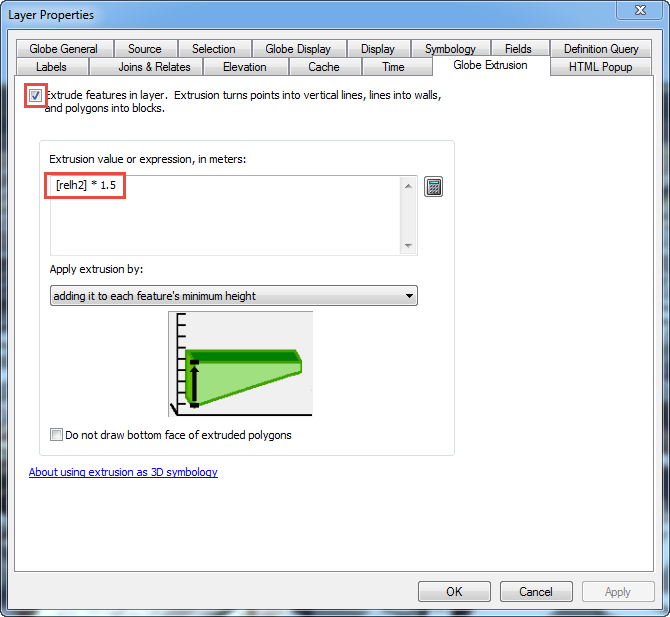
This will extrude the buildings using the RelH2 attribute with a vertical exaggeration of 1.5 times (i.e. buildings will be shown 1.5 times their actual height). We found using RelH2 (the relative height from ground level to base of the roof) provides a more useful visualisation over RelHMax (the relative height from ground level to the highest part of the roof) which can lead to some overly tall looking buildings where they include towers that extend significantly beyond the height of the rest of the roof.

The end result

The image below shows an area of Edinburgh including Edinburgh Castle with Arthurs’ Seat in the background. Aerial imagery from ArcGlobe is draped over OS Terrain 5 data for the region with BHA drawn on top.

OS BHA in ESRI ArcGlobe