ArcMap allows a wide range of symbology to be created. This topic covers creating basic symbology; use the hyperlinks below to jump to a particular section:
Symbology is set through the properties of each layer in ArcMap and determines how the data is drawn. The properties of a layer in ArcMap are accessed through the Layer Properties form. To access this form, double click on a layer item in the table of contents, or select a layer, and then right-click, and from the context menu choose Properties.
Symbology is set on the Symbology tab of this form:
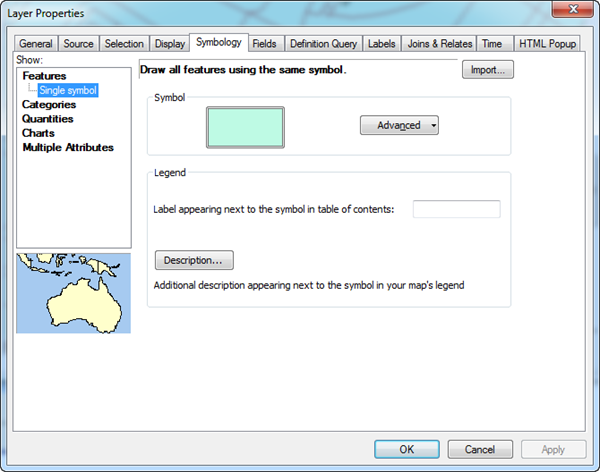
By default ArcMap will use the same symbol for all features in a dataset. To modify the symbol that is used click on the large button in the Symbol panel to bring up the Symbol Selector form.
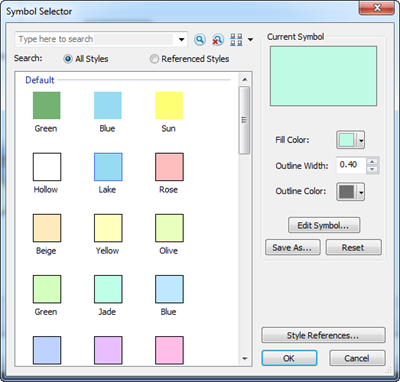
The Symbology options available will vary depending on whether the layer is a point, line or polygon.
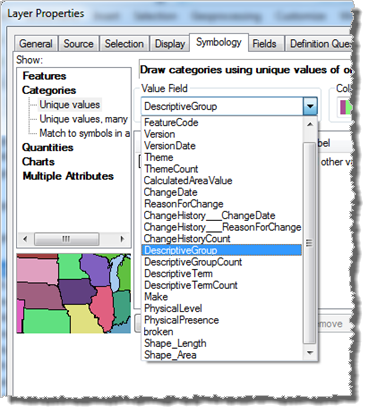
If you want different symbology for different categories within the same layer (e.g. Motorway, A road and B road are all contained within the road dataset) you can select Categories > Unique Value from the left hand panel in the Symbology tab. Next select the Value Field you want the features to be split up by from the drop down:
Click Add All Values, this will populate the table with all attribute values from the selected Value Field and give each one a default colour based on the selected Color Ramp:
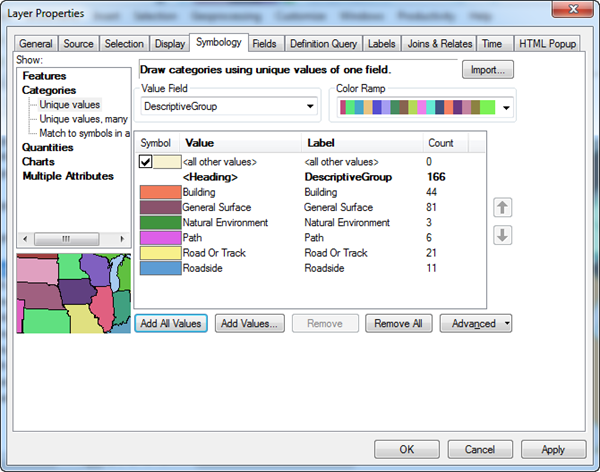
The colours for each category can be modified by double clicking on the colour you wish to change allowing you to set a colour that is appropriate for the feature:
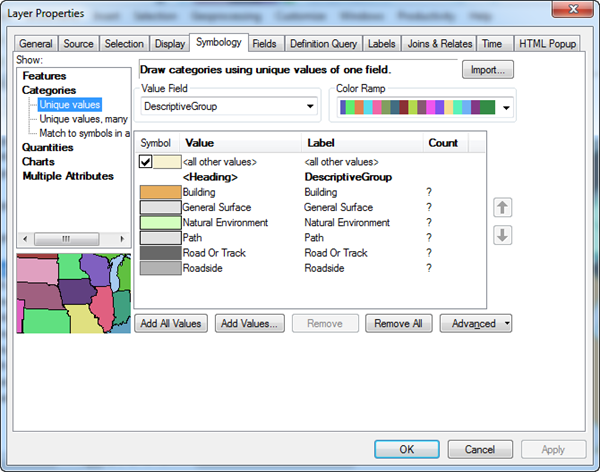
Once you are happy with the colours that have been selected press OK to apply your changes.
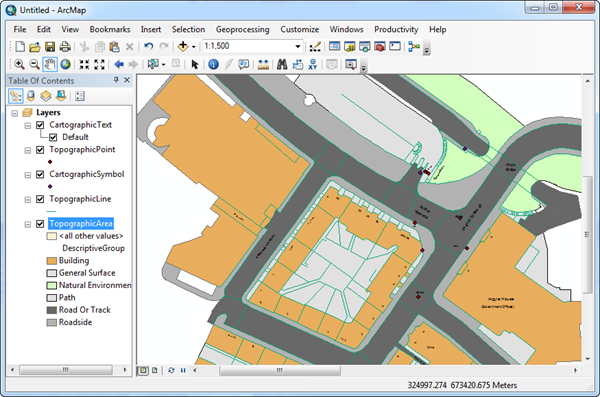
For information on applying existing styling please refer to the applying style files topic.
More details about setting up symbology in ArcMap can be found in the ArcGIS Help files or in the EDINA Digimap Training webpage.